Sherpa Atlas · About us
One map of the assets, networks, plans and owners behind a project
Sherpa Atlas helps infrastructure professionals identify opportunities, compare locations and understand the constraints that can shape a project’s viability. It connects assets, networks, development plans and ownership information in one geographic platform, making it easier to assess a project within the market and infrastructure around it.
Why Atlas is useful
Atlas brings these relationships into view so users can narrow their options, identify questions earlier and concentrate on opportunities worth pursuing
A location’s attractiveness depends on more than the site itself. A data centre needs electricity and fibre access, with connection timing that fits its development schedule. A wind project’s prospects depend on its permitting stage, grid requirements and ownership. A nearby district-heating network may create an opportunity to use recovered heat.
Compare
Infrastructure teams often need to compare opportunities that look similar at first but face very different conditions. Two sites in the same country may have different levels of competing power demand, access to communications infrastructure or dependence on planned network upgrades. Two projects with similar capacity may be at very different stages of development.
Decide earlier
Atlas helps users make those distinctions before committing substantial time and resources. By examining a location alongside its surrounding infrastructure and competing developments, teams can build a more informed shortlist and identify dependencies that deserve closer investigation.
Share one view
The platform also supports a shared view across commercial, investment and technical teams. A market assessment can move from a broad geographic overview to specific assets, owners and network conditions. This gives discussions a concrete starting point and helps teams frame more precise questions for counterparties.
What Atlas covers
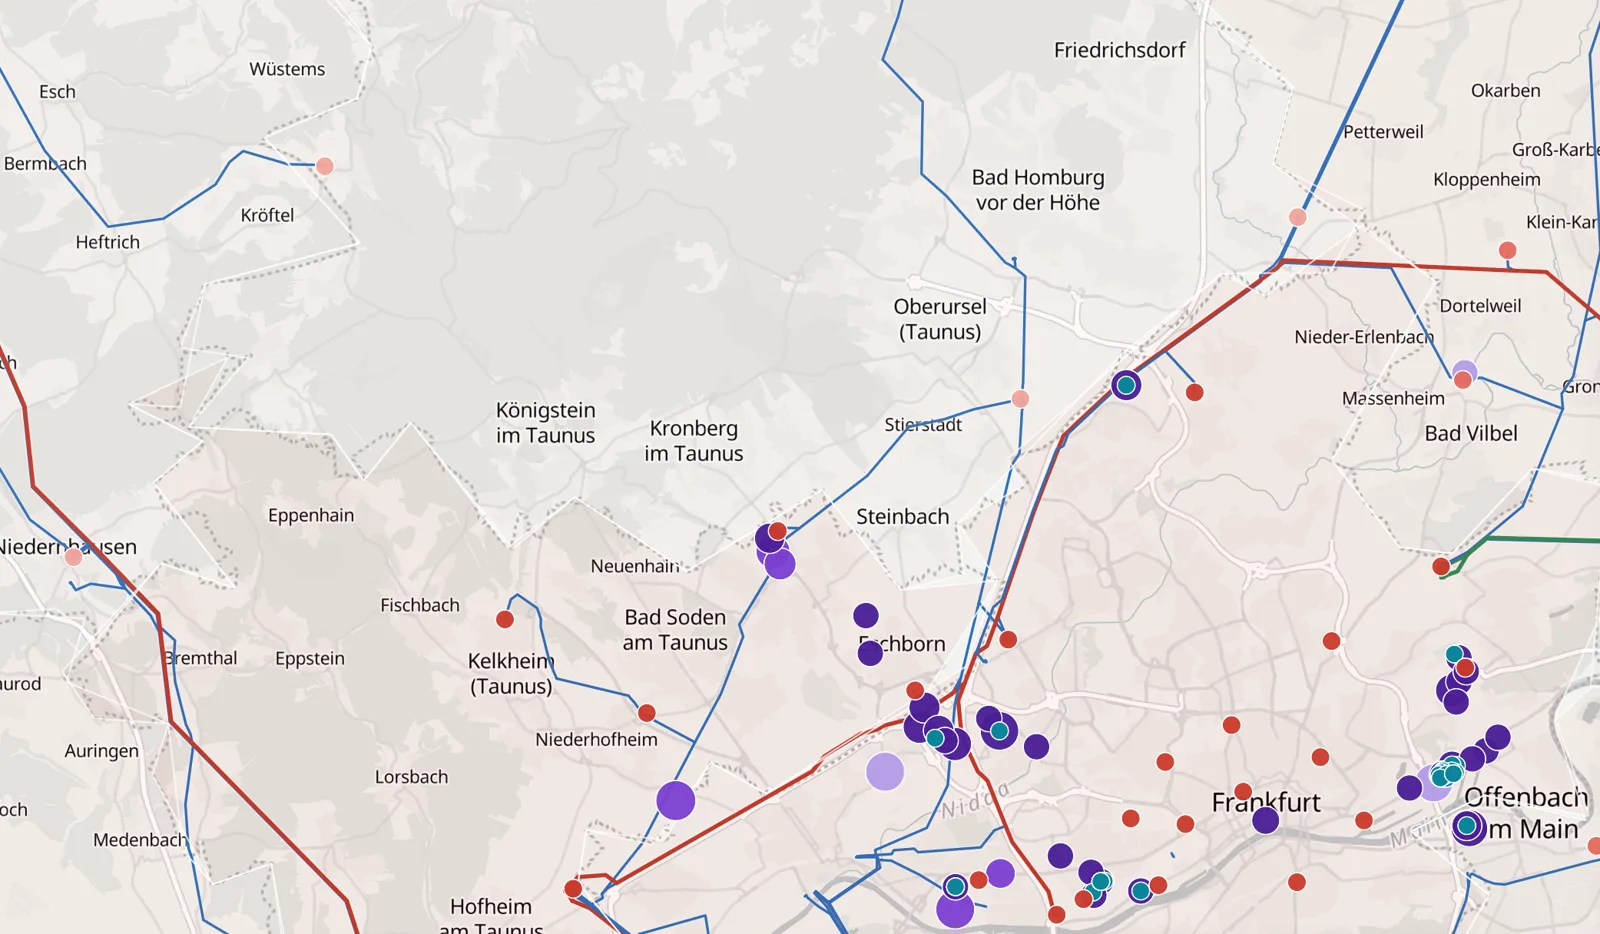
The high-voltage grid and power plants worldwide; and in its country editions, substations, grid upgrades, connection queues, data centres, district heating, fibre and wind farms
From country to asset
Users can move from a country overview to a region, planning area or individual asset. Depending on the dataset, detailed records include capacity, operating or development status, ownership, permitting milestones and relationships with surrounding infrastructure. Tables, filters and market summaries support comparisons across locations, projects and companies.
Grid and data centres
Grid and data-centre views bring together queued and reserved demand, network reinforcement, nearby substations, connectivity and heating networks. These help users assess how a development relates to local infrastructure and where further investigation is needed.
Wind farms
Wind-farm views connect operating plants and development projects with their owners, development stages and capacity. Users can examine the composition of a market, compare portfolios and distinguish established operations from future development activity.
How professionals use Atlas
Six ways teams put the map to work
Screen locations and build a shortlist
Developers and operators can examine the infrastructure around potential sites, compare alternatives and identify locations that merit detailed assessment. This helps focus site visits, technical enquiries and commercial discussions.
Identify project dependencies earlier
Investors, lenders and development teams can investigate competing demand for grid access, planned reinforcement and the status of nearby infrastructure. Understanding these dependencies helps teams challenge assumptions about timing and frame diligence around the issues most likely to affect delivery.
Assess development pipelines
Users can distinguish operating assets from projects at different stages, examine where development is concentrated and compare capacity across regions. This supports a clearer assessment of market activity and the maturity of a pipeline.
Find relevant owners and counterparties
Ownership and company views help users identify who is active in a location or market, examine portfolios and prepare more targeted acquisition, partnership or business-development discussions.
Explore opportunities between infrastructure sectors
Viewing data centres, power networks, fibre and district heating together helps users identify relationships that deserve commercial or technical investigation, including connectivity options and potential heat-use partnerships.
Prepare market and investment assessments
Advisers, utilities and investment teams can use geographic and asset-level views to structure comparisons, explain local conditions and develop a focused set of questions for further work.
From market overview to project detail
A practical workflow, from the whole market down to one record
Select a market
Start from a country or region.
Narrow the geography
Move to a region, planning area or site.
Choose the infrastructure
Grid, data centres, plants, fibre or heat.
Examine what matters
The assets or networks behind the picture.
A team assessing data-centre development can start with regional demand and grid conditions, then investigate individual locations and nearby connectivity. An investor exploring wind opportunities can compare owners and portfolios, then examine projects by capacity and development stage. An adviser can move between market totals and individual records to understand what sits behind the broader picture.
The platform distinguishes between operating assets and developments at different stages. It also separates capacity measures that describe different things, such as an operating installation, queued demand, reserved power or a development target. These distinctions make comparisons more useful and help users avoid treating every project in a pipeline as equally mature.
Coverage and detail vary by country and dataset. Atlas supports initial screening, comparative analysis and the preparation of focused commercial and technical assessments.
Part of Global Infrastructure Sherpa
Atlas adds a geographic dimension to GIS research
Global Infrastructure Sherpa
Sherpa Atlas is a product of Global Infrastructure Sherpa (GIS), an independent data and boutique research business focused on digital infrastructure, data centres, energy systems and infrastructure investment.
What GIS provides
GIS provides market intelligence, company and counterparty information, research publications, enterprise data and commissioned analysis. Its coverage spans acquisitions, financings, partnerships, project development and power procurement, together with the institutions involved and the roles they play.
Where Atlas fits
Atlas connects physical assets and development plans with the networks they depend on and the companies behind them, helping users assess both the opportunity at a particular location and its position in the wider market.
See it on the map, then talk to us.
Data sources
* Power plants worldwide (Global reference data): Global Energy Monitor, Global Integrated Power Tracker, September 2026 release (CC BY 4.0); units combined into plants. Licensed under CC BY 4.0.
* Japan: register of certified renewable projects, Agency for Natural Resources and Energy (as of 30 Sep 2026; Government Standard Terms of Use 2.0). Positions at town level: 大字・町丁目位置参照情報 国土交通省 (2025, 19.0b).
Power lines: © OpenStreetMap contributors (ODbL).