District heating map: where recovered heat can go
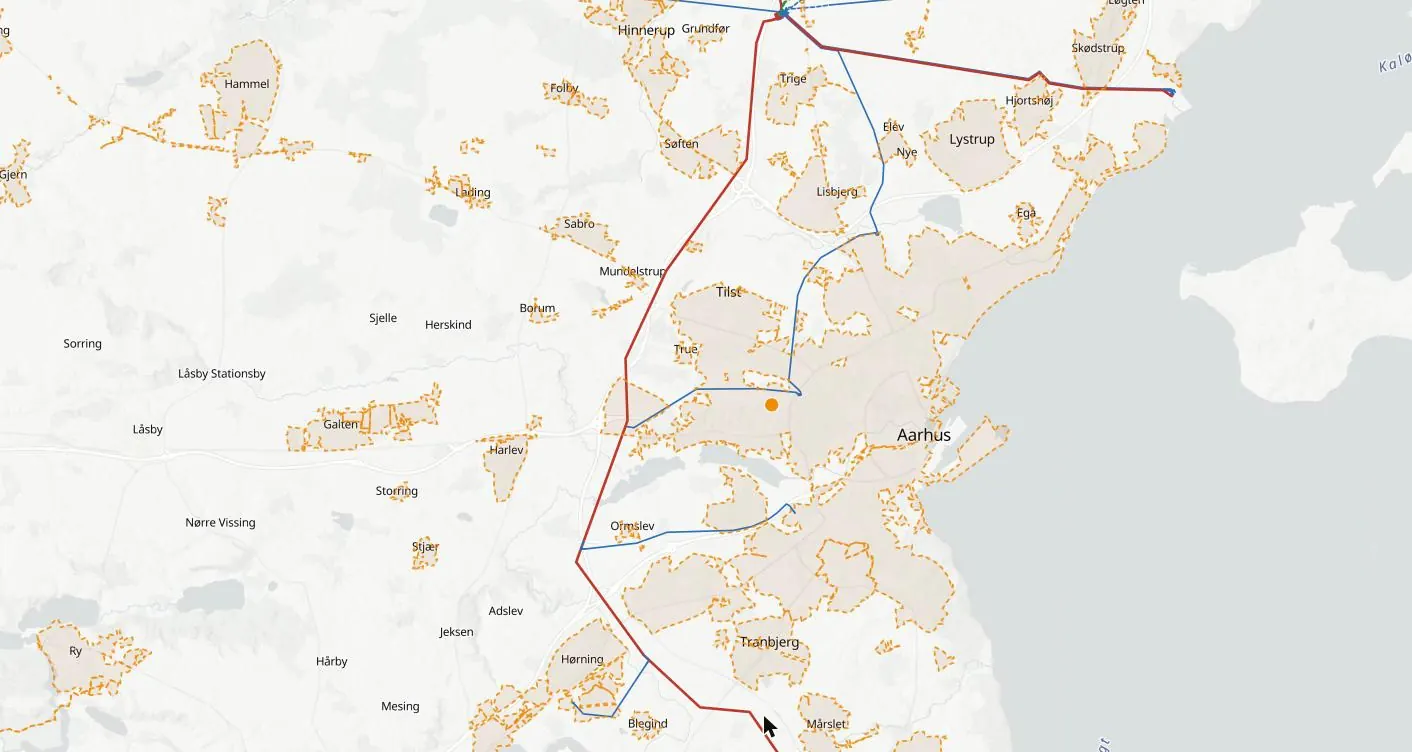
A data centre next to a heating network can sell its heat. Sherpa Atlas maps district heating networks and the data-centre waste-heat projects already reported, on the same map as data centres, substations and plants.
What the map shows
District heating, with everything that decides a project around them
Heating networks
District heating networks and their areas, with operator where published.
Waste-heat projects
Data centres reported to supply heat to a network, with status and date.
Data centres nearby
Operating and planned data centres close to each network.
The grid
Substations and power lines around them.
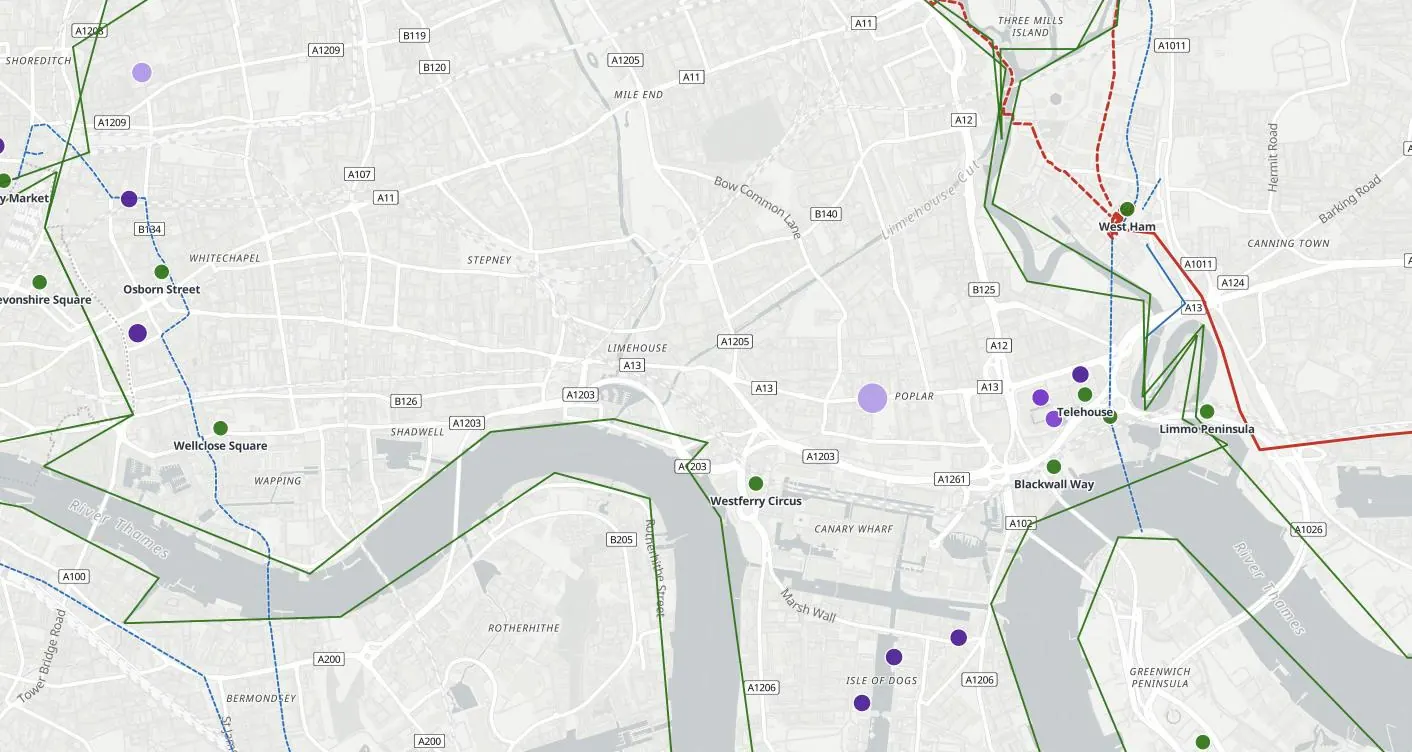
Open any dot
Every record with its sources and date
Each district heating record opens in full: status, capacity as stated, owners, the grid around it and every source, dated. Search any place, site, company or coordinates.
Who uses it
How teams use the district heating map
Data-centre developers
Pick sites where heat can be sold, as heat reuse is increasingly expected of new data centres.
Heat-network operators and utilities
Find data centres that could supply heat, and approach them early.
Municipalities
Plan new data-centre zones around heat demand.
Advisers
Build heat-reuse cases on real networks and projects.
Try it first
See it before you buy it
A free record
Click any dot on the map to open one record in full.
A free account
Three full records a day, and a demo area in full in every country edition.
A country in full
From $400 a month, first month half price. Cancel any time, or save with 6 months or a year. See prices →
Global Access
Every country and every layer, for one user, a team or an organisation, on request. Ask for access →
Questions
The district heating map: questions
What does the district heating map show?
District heating networks and data-centre waste-heat projects, next to data centres, substations and plants.
Where does the data come from?
Every record carries its sources and the date it was last checked: grid operators, regulators and governments, planning authorities, company announcements and the press. Nothing is estimated where a figure has been published; where no figure is published, the record says so.
Is it free?
Click any dot for one full record, free. A free account opens three full records a day and a demo area in full in every country edition. A country in full is from $400 a month, first month half price; Global Access to every country and layer, for one user, a team or an organisation, is on request.