Grid upgrades: the reinforcements that will open new capacity
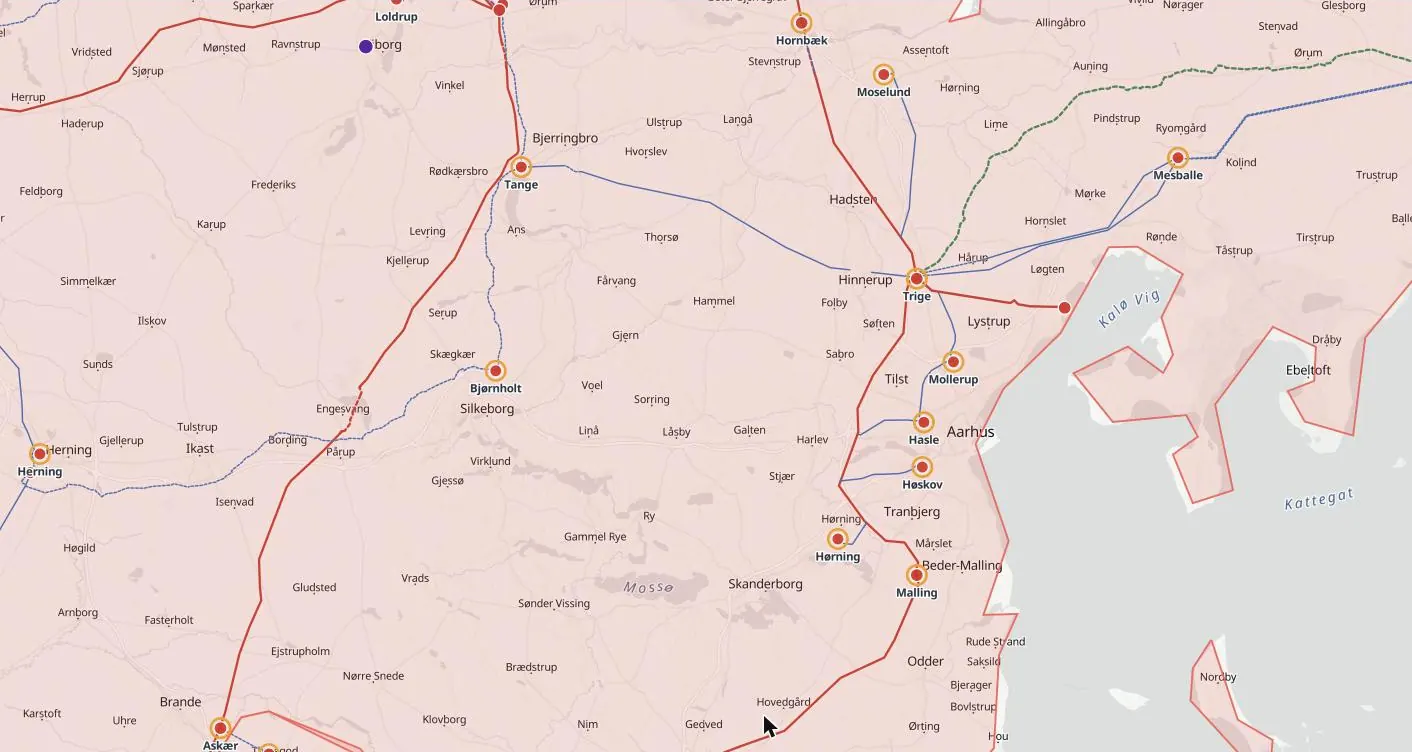
Where the grid is full today may have room in three years. Sherpa Atlas maps the reinforcements in grid operators’ published plans, new lines, new substations and transformer upgrades, by stage and expected year, on the substations they name.
What the map shows
Grid upgrades, with everything that decides a project around them
The measure
New lines, substations, transformers and interconnectors, with voltage and capacity where stated.
Stage and year
Completed, under construction, planned or in permitting, with the year the operator gives.
On the map
Each upgrade on the substations it names, with their current published status.
The source
The operator’s plan or statement, linked and dated.
Open any dot
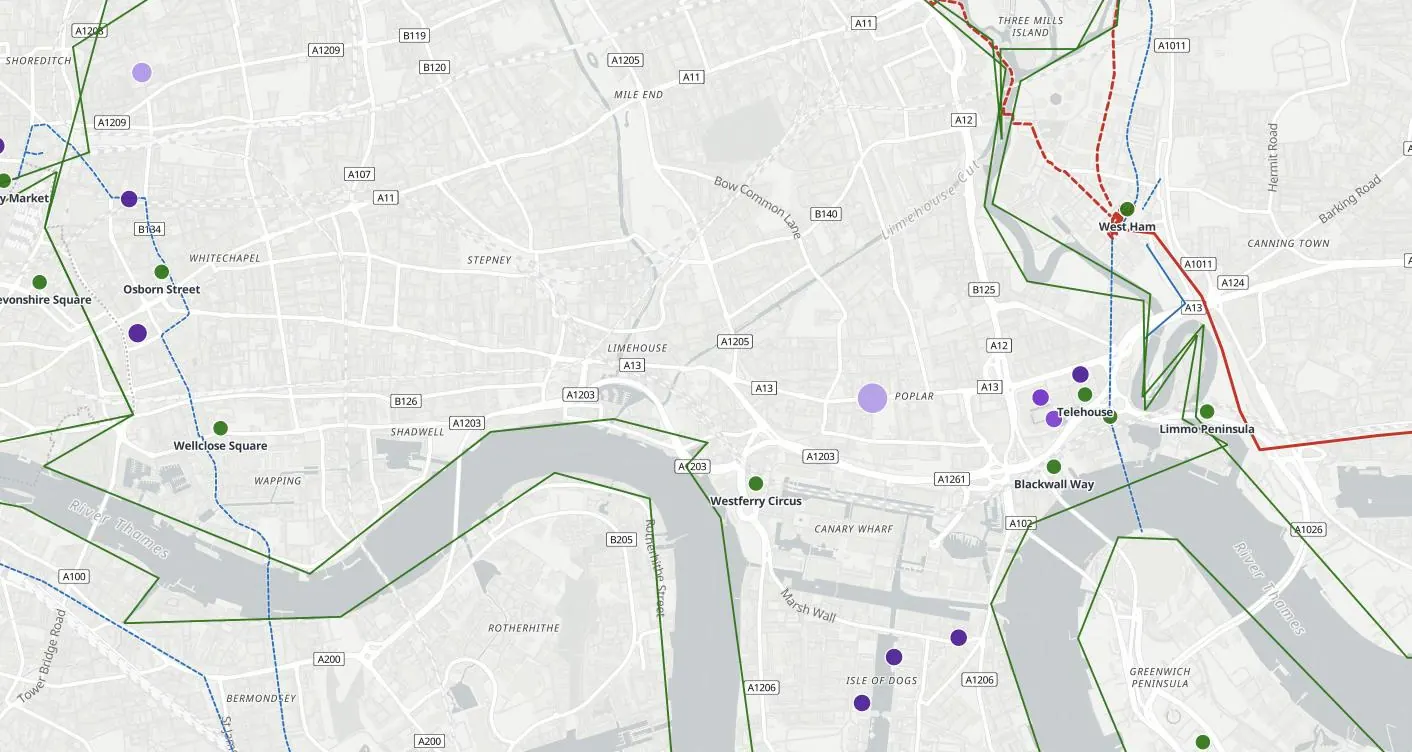
Every record with its sources and date
Each grid upgrade record opens in full: status, capacity as stated, owners, the grid around it and every source, dated. Search any place, site, company or coordinates.
Who uses it
How teams use the grid upgrade map
Developers
Time a site to the reinforcement that will free capacity, and avoid areas with nothing planned.
Investors
Judge whether a project’s connection date depends on an upgrade still in permitting.
Construction and equipment suppliers
See grid projects by stage and year to plan bids and capacity.
Policy and economic development
See where grid investment is going, and where it is not.
Try it first
See it before you buy it
A free record
Click any dot on the map to open one record in full.
A free account
Three full records a day, and a demo area in full in every country edition.
A country in full
From $400 a month, first month half price. Cancel any time, or save with 6 months or a year. See prices →
Global Access
Every country and every layer, for one user, a team or an organisation, on request. Ask for access →
Questions
The grid upgrade map: questions
Which upgrades are shown?
The reinforcements grid operators publish in their plans and statements, each with its stage and year, placed on the substations it names.
Where does the data come from?
Every record carries its sources and the date it was last checked: grid operators, regulators and governments, planning authorities, company announcements and the press. Nothing is estimated where a figure has been published; where no figure is published, the record says so.
Is it free?
Click any dot for one full record, free. A free account opens three full records a day and a demo area in full in every country edition. A country in full is from $400 a month, first month half price; Global Access to every country and layer, for one user, a team or an organisation, is on request.