Sherpa Atlas · Brazil
Brazil’s data centres, grid and power plants on one map
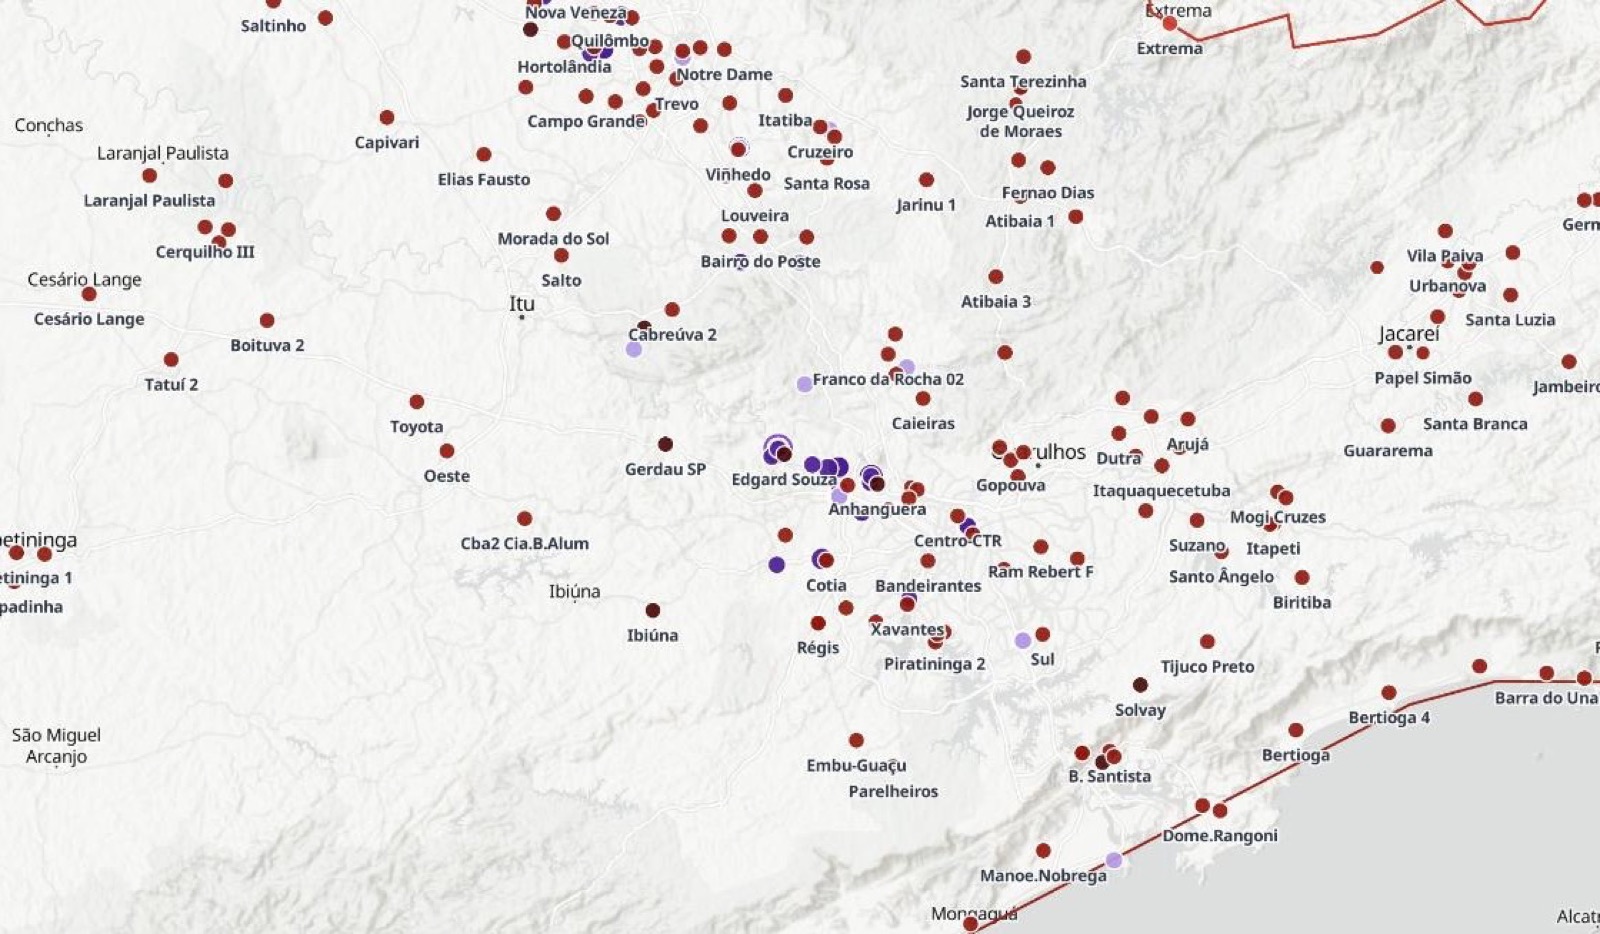
Brazil is Latin America’s largest data-centre market, led by São Paulo, and a major builder of wind and solar. The Brazil edition maps each data centre with its operator, stage and stated capacity, next to the substations, power lines, grid works and generation around it.
What the Brazil edition covers
Data centres, substations, grid upgrades and wind, solar and hydro plants across Brazil
Data centres
Operating sites and those under construction or planned, each from its operator’s own pages, with the capacity it states and what that figure measures, placed next to the grid. Alongside them, the large-load connection requests the grid operator has received, by town.
Substations and grid works
The substations of the national operating grid, with 69–138 kV substations across São Paulo, Minas Gerais, Rio de Janeiro and Espírito Santo. Transmission works under way with their official dates, and the works the planners expect the grid to need. Where the grid operator has published the capacity left for new load at a substation, the figure is on its record. Every state is coloured by the data-centre demand requested there and the generation planned.
Power plants with owners
Every wind farm, solar plant and hydro plant of 1 MW and more, from operating to not yet started, with its owners and their shares, its capacity and its start of operation, on the main map. Thermal, biomass and nuclear plants in the country view.
Where the market is
From the São Paulo cluster to the renewable Northeast
São Paulo
The country’s main cluster: Barueri, Santana de Parnaíba and Tamboré, Osasco and Cotia, and the corridor north through Jundiaí and Campinas to Sumaré, Hortolândia and Vinhedo
Rio de Janeiro
The second market, with new campuses planned
The Northeast
Fortaleza, where the submarine cables land, and Bahia, Ceará, Rio Grande do Norte and Piauí, where most of the wind and solar is built and renewable-powered campuses are being planned
The South and Centre-West
Porto Alegre and Eldorado do Sul, Brasília and the regional markets
How teams use it
Three ways to put the Brazil map to work
Screen sites for power
See the substations, power lines and grid works around a location, the generation built and planned nearby, and what the grid operator and the planners have said about new data-centre demand, before a site visit or an access request.
Follow the pipeline
See which data centres are operating, under construction or planned, who operates them and the capacity each states, next to the new large-load connection requests the grid operator has received, town by town.
Map the renewables around a site
Find the wind, solar and hydro plants near a site, whether they operate or are still to be built, with their owners and their capacity, for PPAs, self-supply or co-location.
Try it, then subscribe
Open Ceará in full for free, or the whole of Brazil from $400 a month
Free records
Click any dot on the map to open a record in full: 5 free, then 7 a day with a free account.
The Brazil edition in full
From $400 a month, first month half price. Cancel any time, or save with 6 months or a year. Global Access to every country on request.
The free Ceará demo
A free account opens the state of Ceará in full: Fortaleza’s data centres, the substations, and the wind and solar plants around them.
Data centres, grid and generation, from the operators, the regulator and the planners.
Data sources
Substations: Fonte: ONS, Operador Nacional do Sistema Elétrico, open data (CC BY), with changes by Sherpa Atlas. Grid works: ANEEL, Sistema de Gestão da Transmissão (SIGET), Open Database License (ODbL), and EPE, Programa de Expansão da Transmissão and Plano de Expansão de Longo Prazo (PET/PELP), CC BY 4.0. Statements on demand: ONS, EPE, CCEE and the Ministry of Mines and Energy.
Power plants: ANEEL, Sistema de Informações de Geração (SIGA), Open Database License (ODbL).
Data centres: each operator’s own pages, as cited in each record; large-load connection requests and connection results: ONS. Remaining capacity for new load per substation: ONS, NT-ONS DPL 0083/2026, as published by EPE (CC BY 4.0).
69–138 kV substations and power lines: © OpenStreetMap contributors (ODbL).