Data centre map of Australia
Australia’s data centres concentrate in Sydney and Melbourne, with Canberra, Brisbane, Perth and Adelaide growing. The edition maps each site with its operator, stage and stated capacity in every state and territory, next to the substations where the transmission operators state capacity for new load, and the generation planned around them.
What the map shows in Australia
Data centres in Australia, with the grid around them
Every stage
Operating, under construction, permitted, planned, announced, on hold and cancelled sites, coloured by stage.
Capacity as stated
The MW published for each site, and what it measures: IT load, total power or grid connection.
Who owns it
Operator, group and the investors, lenders and power buyers named for the site, each with the date it was reported.
What is around it
The nearest substations and their published grid status, power lines by voltage, plants, fibre, internet exchanges and district heating.
By local government areas
Every local government area of Australia is coloured by what is planned and published there, and each opens its own list of sites, plants, upgrades and statements.
Also in the Australia edition
Substations and grid capacity, data centres, plants and their owners, fibre and internet exchanges, grid upgrades and statements.
Open any dot
Every record with its sources and date
Each data centre record opens in full: status, capacity as stated, owners, the grid around it and every source, dated. Search any place, site, company or coordinates.
Who uses it
How teams use the data centre map of Australia
Data-centre developers and operators
Screen regions for power and land before committing to a site, compare clusters and see where competing campuses are already queued for the same grid.
Investors and lenders
Check a target’s competitive set, the stage of nearby projects and the grid constraints that could shift delivery dates before diligence starts.
Utilities and power producers
Find where new data-centre demand is concentrating to plan connections, PPAs, storage and new generation close to it.
Construction, engineering and equipment suppliers
Follow projects from planning to construction to time business development to the stage where equipment and contracts are decided.
Try it first
See it before you buy it
A free record
Click any dot on the map to open one record in full.
A free account
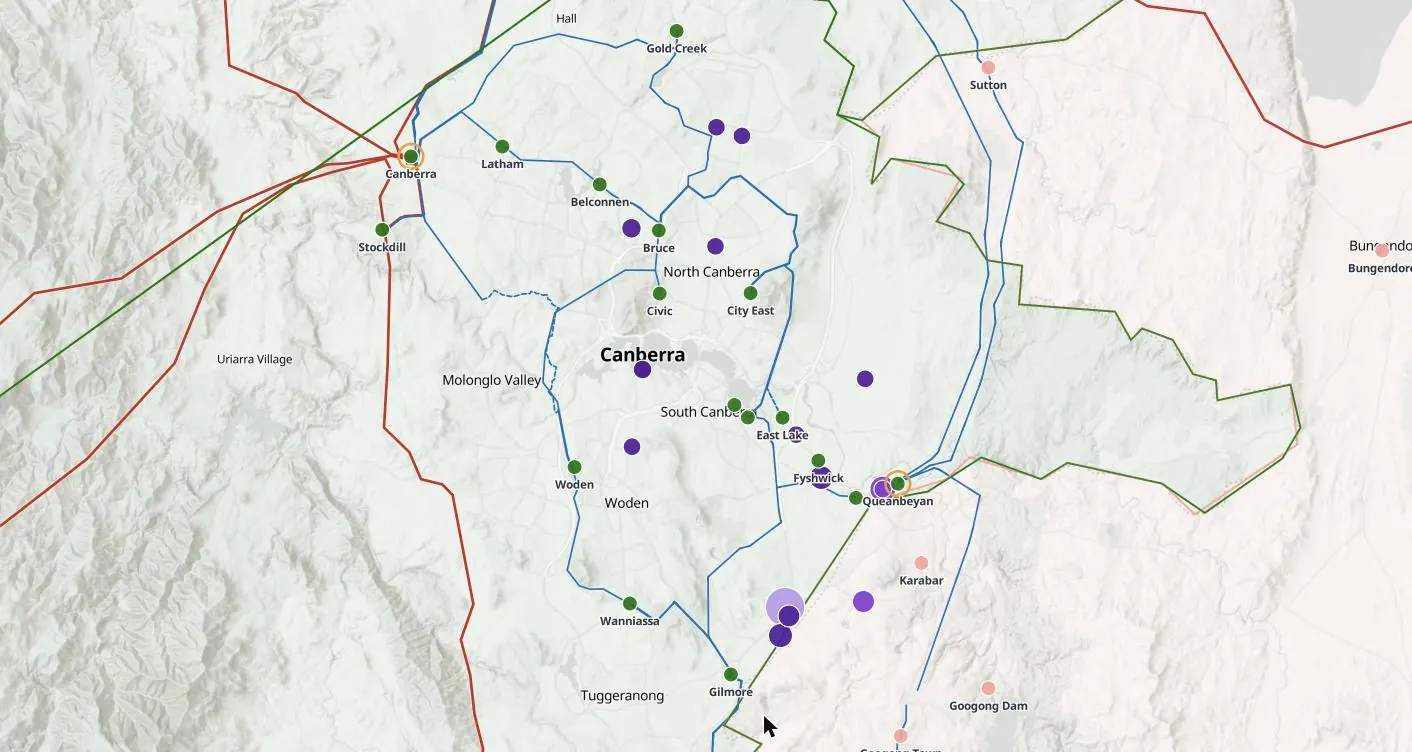
Three full records a day, and a demo area in full in every country edition: in Australia, Canberra (ACT).
A country in full
From $400 a month, first month half price. Cancel any time, or save with 6 months or a year. See prices →
Global Access
Every country and every layer, for one user, a team or an organisation, on request. Ask for access →
Questions
The data centre map of Australia: questions
What does the data centre map of Australia show?
Data centres in Australia on one map: operator, stated MW and stage for every site, next to the substations, power lines, plants and fibre around it.
Whose figures are used in Australia?
Published figures from AEMO and the transmission network operators, and from regulators, governments, planning authorities, company announcements and the press, each with its source and date.
Can I try the Australia edition free?
Yes. A free account opens three full records a day and Canberra (ACT) in full as a demo area. The whole country is from $400 a month, first month half price; Global Access to every country is on request.
The data centre map in other countries
Other maps of Australia