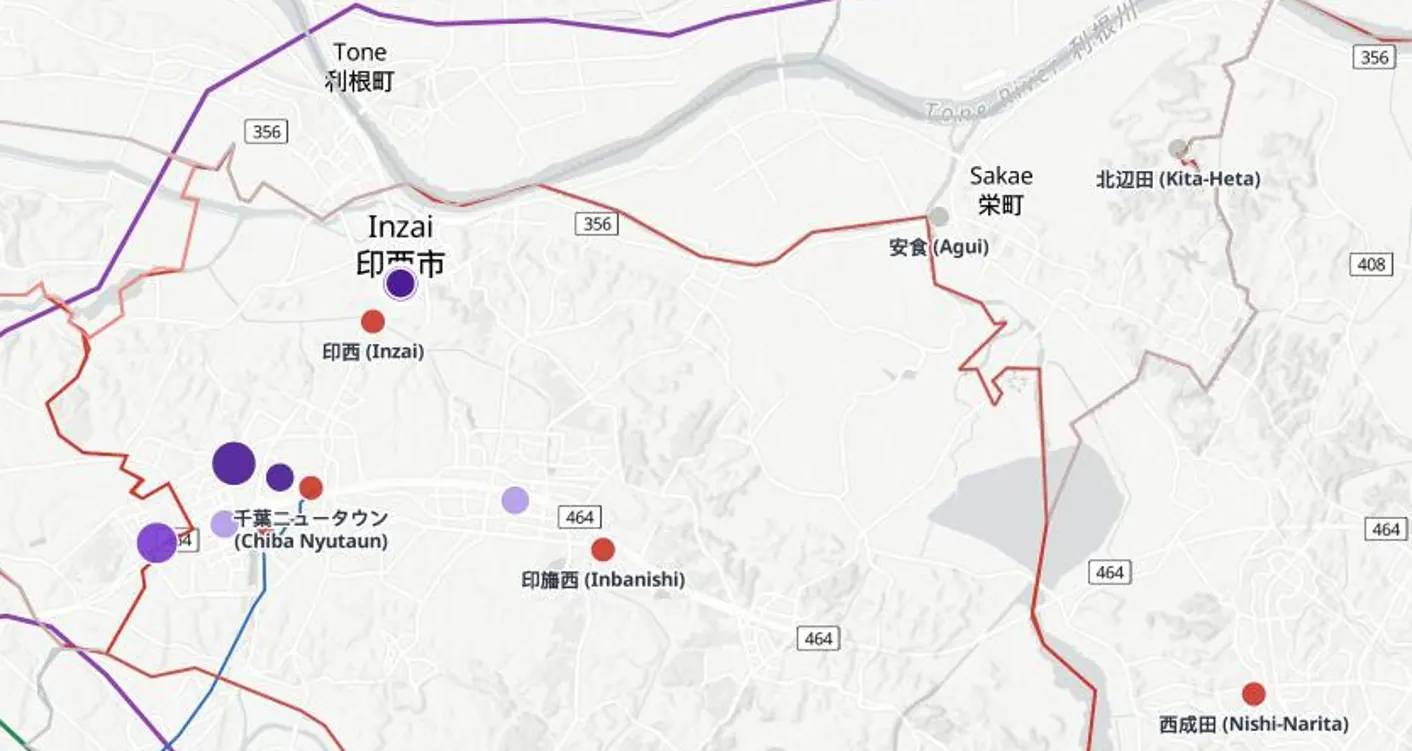
Grid capacity map of Tokyo
TEPCO Power Grid serves Tokyo and the eight prefectures around it. The edition maps its substations of 66 kV and above, each with its Japanese name and romanisation, colours every municipality by the data-centre capacity stated there and the generation planned, and lists the interregional and in-area reinforcements in OCCTO’s plans and what OCCTO and the government have said about data-centre demand.
What the map shows in Tokyo
Substations and grid capacity in Tokyo, with the grid around them
Substations by voltage
Transmission and high-voltage distribution substations, with operator, voltage and area.
Published grid status
Room to connect where the operator states it; the demand already requested of the grid where that is what is published. Always the operator’s own figure, with its date.
Upgrades and statements
Grid reinforcements and new substations from the operators’ plans, and what operators, regulators and governments have said about capacity.
Demand and supply around it
Data centres, plants and projects near each substation, with power fed in and power drawn shown apart.
By municipalities
Every municipality of Tokyo is coloured by what is planned and published there, and each opens its own list of sites, plants, upgrades and statements.
Also in the Tokyo edition
Substations and grid capacity, data centres, plants and their owners, grid upgrades and statements.
Open any dot
Every record with its sources and date
Each grid capacity record opens in full: status, capacity as stated, owners, the grid around it and every source, dated. Search any place, site, company or coordinates.
Who uses it
How teams use the grid capacity map of Tokyo
Developers of data centres and large loads
Find substations with room to connect, and see where the demand already asked of the grid makes a connection unlikely before a site is optioned.
Renewable and storage developers
Compare areas by the generation already planned and the room left for more, and follow the upgrades that will open new capacity.
Investors and lenders
Test whether a project’s connection date and grid assumptions hold against what the operator has published.
Grid operators, utilities and consultants
See where demand and generation requests concentrate across operator boundaries, on one map.
Try it first
See it before you buy it
A free record
Click any dot on the map to open one record in full.
A free account
Three full records a day, and a demo area in full in every country edition: in Tokyo, Inzai (Chiba).
A country in full
From $400 a month, first month half price. Cancel any time, or save with 6 months or a year. See prices →
Global Access
Every country and every layer, for one user, a team or an organisation, on request. Ask for access →
Questions
The grid capacity map of Tokyo: questions
What does the grid capacity map of Tokyo show?
Substations in Tokyo coloured by the grid capacity the operators publish, with upgrades, the demand already asked of the grid and the projects around each.
Whose figures are used in Tokyo?
Published figures from OCCTO, the Agency for Natural Resources and Energy and the Japanese government, and from regulators, governments, planning authorities, company announcements and the press, each with its source and date.
Can I try the Tokyo edition free?
Yes. A free account opens three full records a day and Inzai (Chiba) in full as a demo area. The whole country is from $400 a month, first month half price; Global Access to every country is on request.
The grid capacity map in other countries
- Grid Capacity Map of Norway
- Grid Capacity Map of Sweden
- Grid Capacity Map of Denmark
- Grid Capacity Map of Finland
- Grid Capacity Map of Italy
- Grid Capacity Map of Germany
- Grid Capacity Map of Benelux
- Grid Capacity Map of France
- Grid Capacity Map of Great Britain
- Grid Capacity Map of Australia
- Grid Capacity Map of South Korea
Other maps of Tokyo